Using graphics program to make timelines, diagrams

  • Welcome to Christian Forums, a Christian Forum that recognizes that all Christians are a work in progress.

    You will need to register to be able to join in fellowship with Christians all over the world.

    We hope to see you as a part of our community soon and God Bless!

Douggg

Well-Known Member
Nov 26, 2020
3,503
265
83
76
Memphis
Faith
Christian
Country
United States
I use Corel Paintshop Pro program to make timelines and diagrams. I use such timelines and diagrams in discussions regarding the end times.

This thread I am going to go through some of the steps to using the program.

The basic fundamental principle is how to make layers. layers are like cutouts that are stacked one on top of the other.

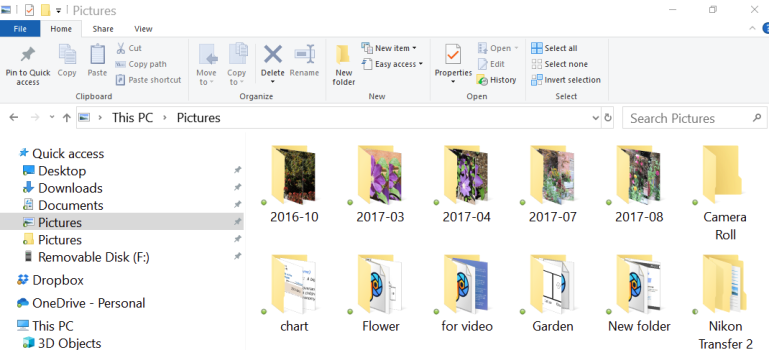
The layers can be manipulated in many ways for the desired results. And when finished, save the file to your computer in a pictures folder you create. Here is a screen shot of my pictures - and the one I named as "charts" is where I save my timelines and diagrams to.


1717829608233.png
 
  • Like
Reactions: St. SteVen

Douggg

Well-Known Member
Nov 26, 2020
3,503
265
83
76
Memphis
Faith
Christian
Country
United States
When you make a timeline or diagram, and save it, save in two formats.
1. pspimage
2. jpg

The jpg format glues all of the layers together. The jpg format is necessary because that format is what is required to insert the timeline or diagram into a post.

The pspimage format keeps the layers independent - so you can edit youe timeline or diagram without having to start over. Once you get started, it will be clear as what I am saying.
 

Douggg

Well-Known Member
Nov 26, 2020
3,503
265
83
76
Memphis
Faith
Christian
Country
United States
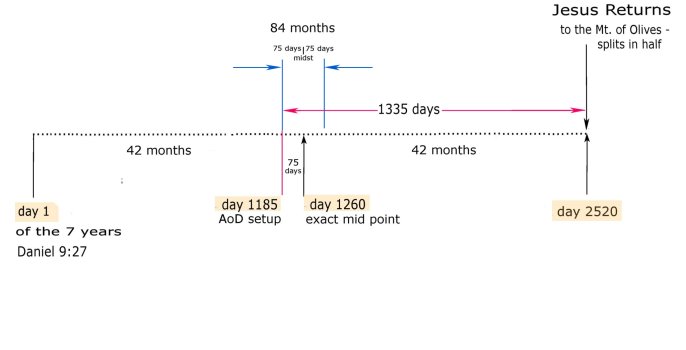
To start, we need to save, right click, a timeline picture, on this one i made, to the chart folder. Once in the chart folder, right click on it and choose "open with" - CorelPaintshop pro". The program will open and the timeline picture will appear for us to begin.

Don't be concerned with the information on the chart, we are going to cover over it and start afresh to learn about making layers.

midst2.jpg
 

Douggg

Well-Known Member
Nov 26, 2020
3,503
265
83
76
Memphis
Faith
Christian
Country
United States
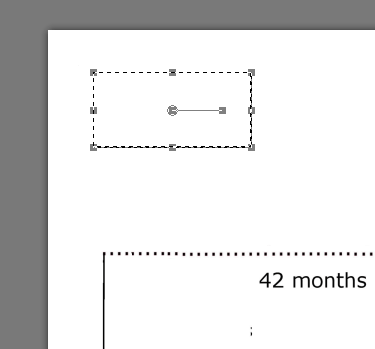
Now with Corel Paintshop pro opened, and the chart showing, we are going to make a layer. click on the arrow icon. The chart will be picked with "handles" in the corners and midpoints.

1717830740181.png

Next, on the selection icon , click, and choose... the first option a rectangle. The layer we will make will have the form of a rectiangle.


1717831000651.png

next, anywhere in the white space, click and drag a rectangle. click the arrow again, and the layer wll be made.

1717831226631.png

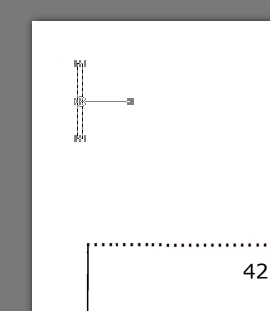
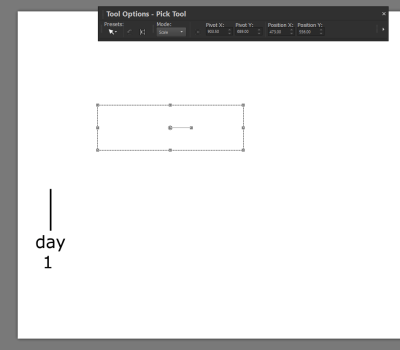
The next thing we are going to do is right click on the created layer, and choose "Duplicate" to make a duplicate lay right on top. We are going to manipulate that layer by dragging narrow to make what will appear as a line.

1717831450901.png

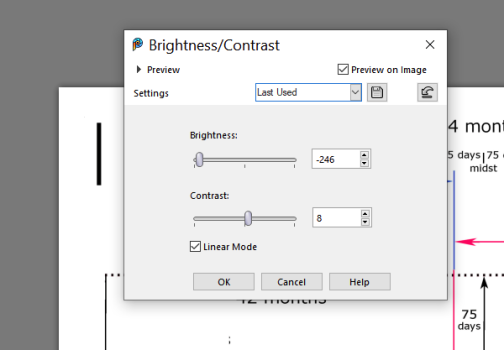
Next, we are going to make the line "black" by up in the top menu under "Adjust", pick "brightness and contrast".

In the dialog box that will appear, drag the brightness slider all the way to the left and the layer will turn black. Our line layer is now black. We can stretch it longer, or shorter, make it wider, or narrower, by gripping the handles and dragging.

1717831738707.png
 

Douggg

Well-Known Member
Nov 26, 2020
3,503
265
83
76
Memphis
Faith
Christian
Country
United States
Narrow the layer to make it looks like a line. You can change the width at at time should you want it narrower or wider.

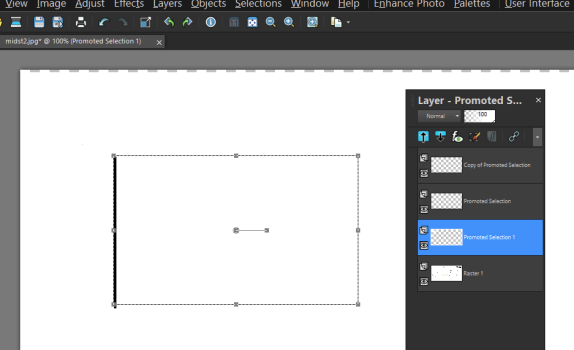
Next we need to make the "layers" palette appear. We do that by in top menu, pick view, then palettes, then
check "layers"

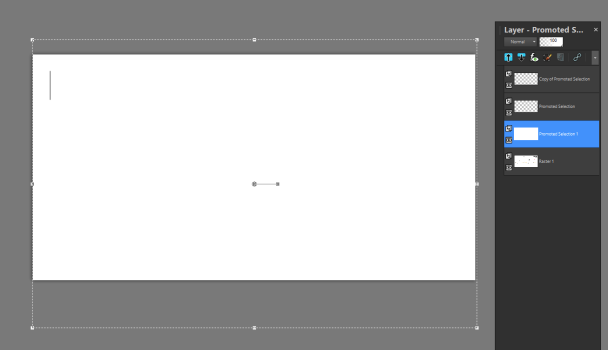
So in the layers palette, click on the first layer we made.... and the first layer will be be picked. We are going to drag that layer big to cover the entire original chart.

1717833266509.png

Zoom out with the wheel on your mouse to see the entire chart. Then by gripping the corner with the mouse arrow, drag it big enough to cover the entire chart. You can widen, lengthen, the layer for this purpose.

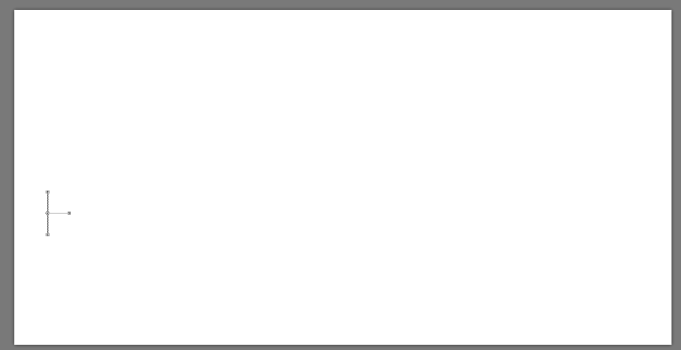
Okay, we now got a blank canvas to work with except for our line layer we created.


1717833625466.png
 

Douggg

Well-Known Member
Nov 26, 2020
3,503
265
83
76
Memphis
Faith
Christian
Country
United States
okay, in this demo timeline we need a start and a beginning line. click on the line layer and drag into the position like I show here. I think I am going to widen the line some, it looks too narrow.

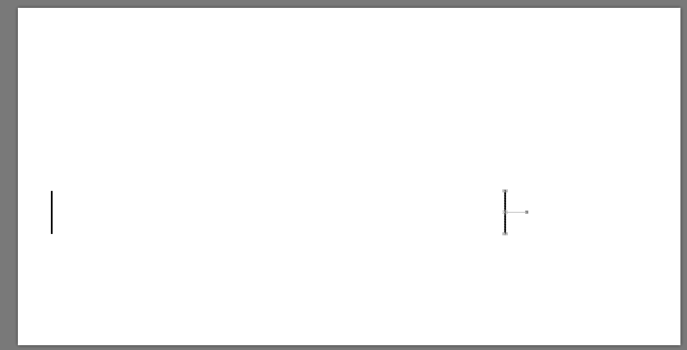
The I am going to right click on the line layer, and duplicate. And then drag the duplicate to the right side.


1717833957866.png

So, now we have a beginning and ending to our timeline. Don't worry if the two lines don't line up, we can always drag them in place later.


1717834224139.png
 

Douggg

Well-Known Member
Nov 26, 2020
3,503
265
83
76
Memphis
Faith
Christian
Country
United States
Now just like we did to make the layer palette to appear, we go to the top men, pick view, then palettes, then
"tool options". btw, you can drag the palettes around anywhere on the screen to get them out of the way, or to a more convenient spot.

The tool options gives four choices as to "mode". The "scale" option allows it that when you widen, lengthen, stretch, compress a layer it does so in an x-y fashion. The "free" option allows for unlimited skewing of the layer. Try it, you will see what I mean.

The layers palette and the tool options palette are the two main palettes you will end up using. So keep those open all the time.


1717834518395.png
 

Douggg

Well-Known Member
Nov 26, 2020
3,503
265
83
76
Memphis
Faith
Christian
Country
United States
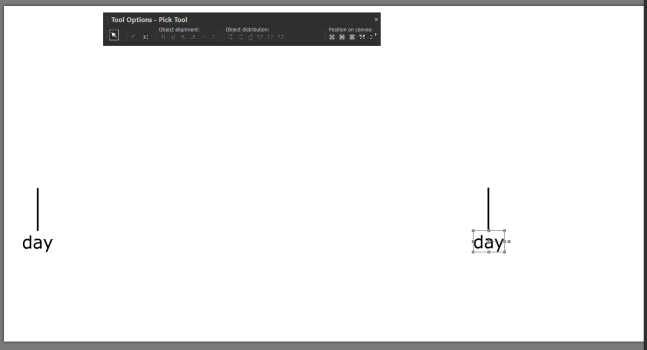
Next we are going to add some text below our start and end lines.

Text can be made in different fonts, i.e. letter styles. For charts, I like to use "Verdana" for it clarity.

But first we are going to click on the "T" icon:

1717835083054.png

Next, anywhere on the chart, click and then go up to the tool options and select the size and type of Font and font color. For type of Font, you may have to type in Verdana.

For size, choose 100. The text size can always be changed later, Either by changing the properties, or just dragging from the corner grips larger or smaller.

Type "day" and drag it into place. You can opt to right click on the first "day" text, and select "copy", then go to Edit in the top men and select "paste as new layer".

1717837858177.png

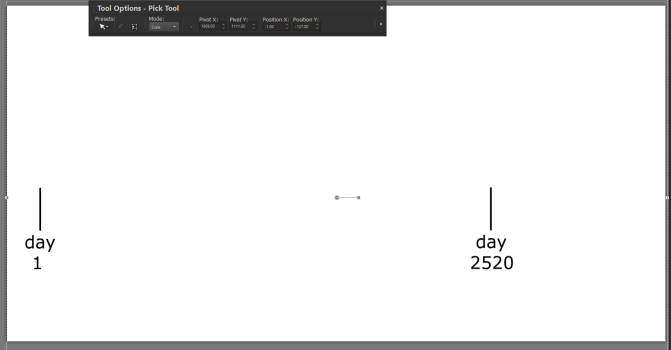
Repeat, and add text of "1" and "2520" and drag into place.

1717838026368.png
 

Douggg

Well-Known Member
Nov 26, 2020
3,503
265
83
76
Memphis
Faith
Christian
Country
United States
Next to provide a highlight background make another layer.

1717838181645.png

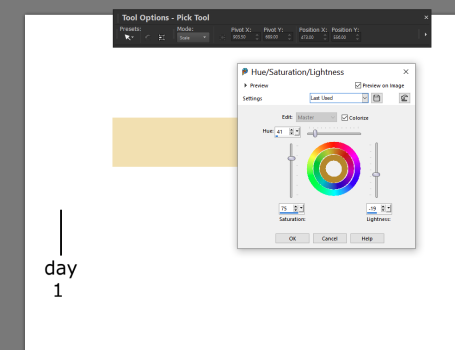
Next, we are going to colorize the layer, by going to the top menu and click "Adjust", then "Hue and Saturation", the "Hue/Saturation/ lightness".

A dialogue box will open. check the colorize box, and adjust to a yellow color (or color of your choice). click
"okay".

1717838517499.png

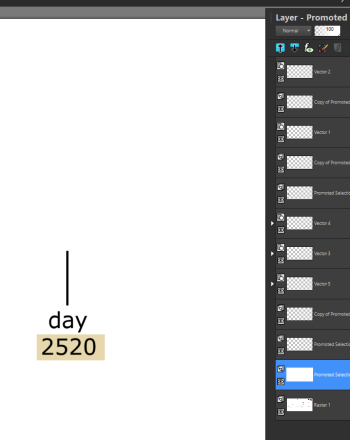
Next, close the dialog box, and drag the colorized layer to a size that will be a back drop for the day numbers. Remember, you can right click on the colorized layer and duplicate it and then drag the duplicate in place below the other day number.

Notice in the layers palette the colored layer is below the vector (text) layers. If it were above the text layers, the colorized layer would cover the text and all you would see is the colorized layer.

The layers can be dragged up and down in the layer palette column, depending which one you want to cover the layer below it.

1717838968390.png
.
 

Douggg

Well-Known Member
Nov 26, 2020
3,503
265
83
76
Memphis
Faith
Christian
Country
United States
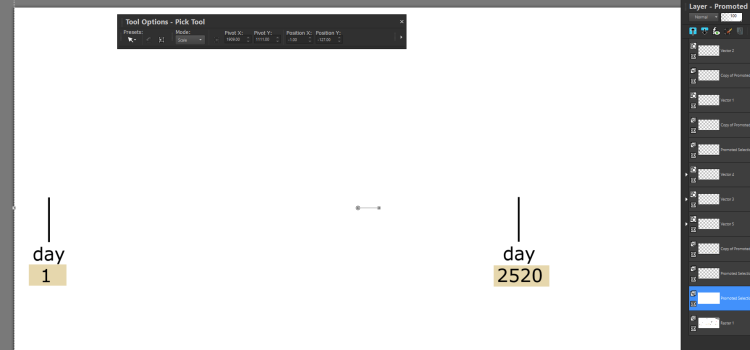
So this is what we have so far....

1717839240391.png

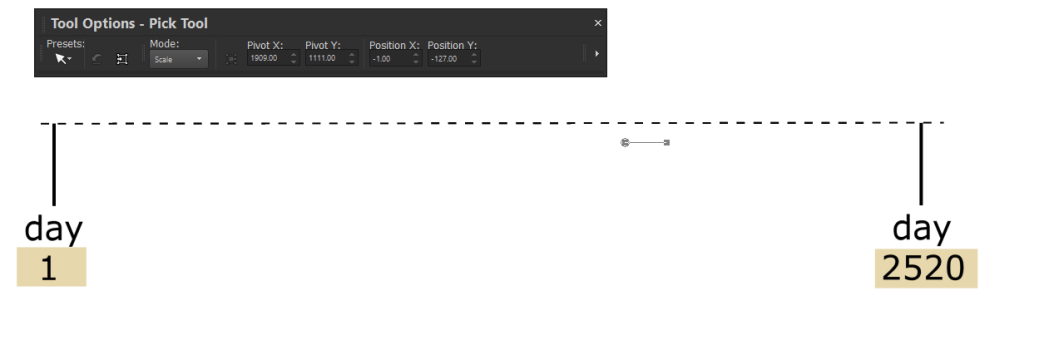
Next let's add a dotted horizontal line for our time line.

Click on the pen icon. In the tool option palette, the pen tool option will appear. click on the arrow all the way to the right and the line style options will appear. Selecte "dashed" , select width "5.00"

And draw a dashed line between the two days. And drag into place.

I have some over hang, which I am going to trim with the eraser tool.


1717840969701.png
 

Attachments

  • 1717840638730.png
    1717840638730.png
    36 KB · Views: 0

Douggg

Well-Known Member
Nov 26, 2020
3,503
265
83
76
Memphis
Faith
Christian
Country
United States
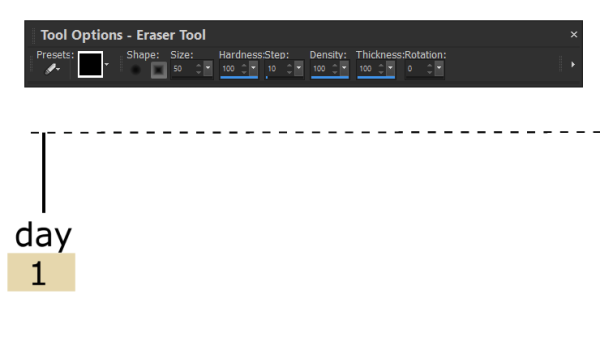
Now to trim that overhang of the timeline, using the eraser tool. The eraser tool allows for the eraser to be different shapes. The only two I use are a circle and a square. For this trim, I am going to use a square.

Click on our eraser tool.

1717841163601.png

In the tool option palette, the eraser tool will appear. Select a square, and an appropriate size, and pick the hardness to 100 for a crisp cut.

1717841317600.png

Next click on the dashed timeline that we are going to trim. You may have to really zoom in, to make the pick on the dashed timeline because it is so thin.

Okay we got that done.


1717841566995.png
 

Douggg

Well-Known Member
Nov 26, 2020
3,503
265
83
76
Memphis
Faith
Christian
Country
United States
I am going to take a break at this point. The Corel Paintshop Pro users guide booklet has much more information. But I am just going through the basics to get you on your way to making timeline charts and diagrams.
 
  • Like
Reactions: St. SteVen

St. SteVen

Well-Known Member
Feb 5, 2023
14,051
5,741
113
69
Minneapolis
Faith
Christian
Country
United States
I am going to take a break at this point. The Corel Paintshop Pro users guide booklet has much more information. But I am just going through the basics to get you on your way to making timeline charts and diagrams.
Interesting topic, thanks.
I am a retired graphic designer. I was a professional user of the Adobe Creative Suite. Primarily PhotoShop, Illustrator and Indesign.

] Behance.com