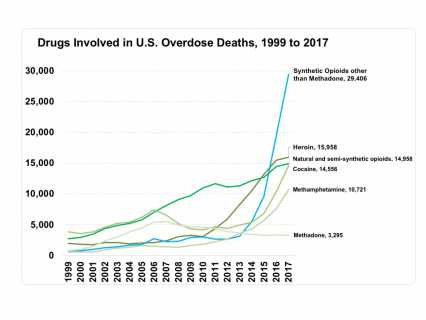
Drugs Involved in U.S. Overdose Deaths* - Among the more than 72,000 drug overdose deaths estimated in 2017*, the sharpest increase occurred among deaths related to fentanyl and fentanyl analogs (synthetic opioids) with nearly 30,000 overdose deaths. Source: CDC WONDER
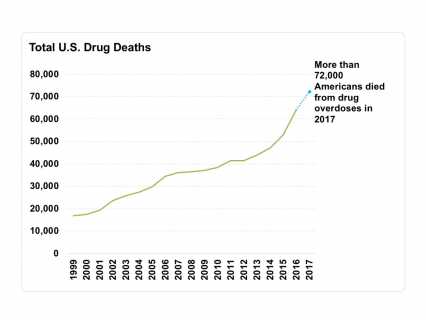
Total U.S. Drug Deaths* - More than 72,000 Americans died from drug overdoses in 2017, including illicit drugs and prescription opioids—a 2-fold increase in a decade. Source: CDC WONDER
* Provisional counts for 2017 are based on data available through 12/17 but are not yet finalized. Counts through 2016 are based on final annual data.
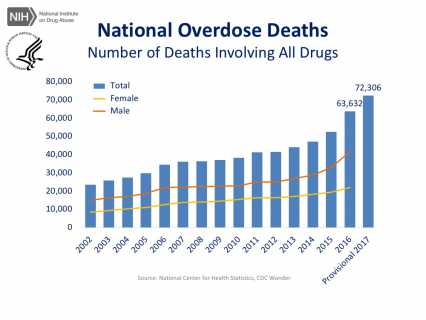
National Overdose Deaths—Number of Deaths Involving All Drugs. The figure above is a bar chart showing the total number of U.S. overdose deaths involving all drugs from 2002 to 2016 and provisional 2017 data. The chart is overlayed by a line graph showing the number of deaths of females and males from 2002 to 2016. From 2002 to 2017 there was a 3.1-fold increase in the total number of deaths.
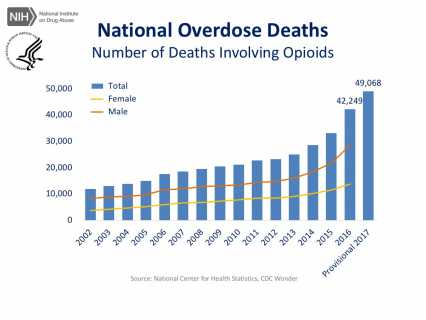
National Overdose Deaths—Number of Deaths Involving Opioid Drugs. The figure above is a bar chart showing the total number of U.S. overdose deaths involving opioid drugs from 2002 to 2016 and provisional 2017 data. Included in this number are opioid analgesics, along with heroin and illicit synthetic opioids. The chart is overlayed by a line graph showing the number of deaths of females and males from 2002 to 2016. From 2002-2017 there was a 4.1-fold increase in the total number of deaths.
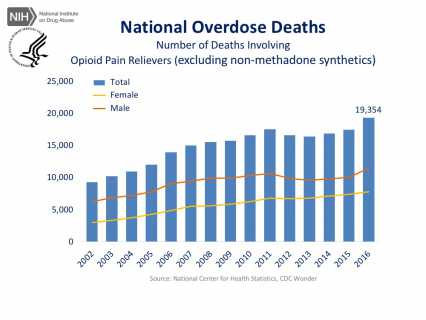
National Overdose Deaths—Number of Deaths Involving Prescription Opioid Pain Relievers (excluding non-methadone synthetics). The figure above is a bar chart showing the total number of U.S. overdose deaths involving opioid pain relievers (excluding non-methadone synthetics) from 2002 to 2016. Non-methadone synthetics is a category dominated by illicit fentanyl, and has been excluded to more accurately reflect deaths from prescription opioids. The chart is overlayed by a line graph showing the number of deaths of females and males. From 2002 to 2011 there was a 1.9-fold increase in the total number of deaths, but it has remained relatively stable since then.
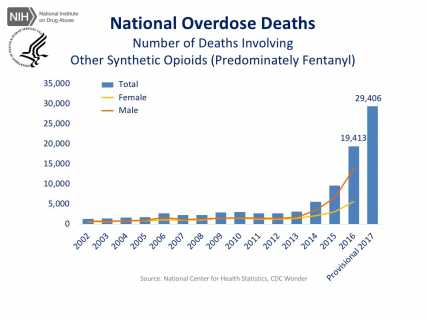
National Overdose Deaths—Number of Deaths Involving Other Synthetic Opioids (Predominately Fentanyl). The figure above is a bar chart showing the total number of U.S. overdose deaths involving other synthetic opioids from 2002 to 2016 and provisional 2017 data. Other synthetic opioids is a category dominated by illicit fentanyl. The chart is overlayed by a line graph showing the number of deaths of females and males. From 2002 to 2017 there was a 22-fold increase in the total number of deaths.
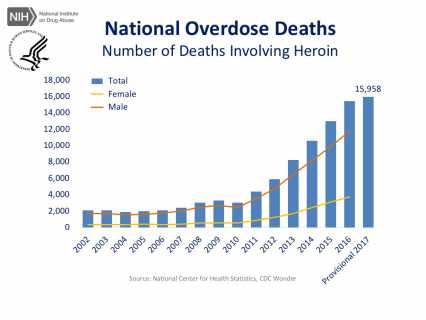
National Overdose Deaths—Number of Deaths Involving Heroin. The figure above is a bar chart showing the total number of U.S. overdose deaths involving heroin from 2002 to 2016 and provisional 2017 data. The chart is overlayed by a line graph showing the number of deaths of females and males from 2002 to 2016. From 2002 through 2017, there was a 7.6-fold increase in the total number of deaths.
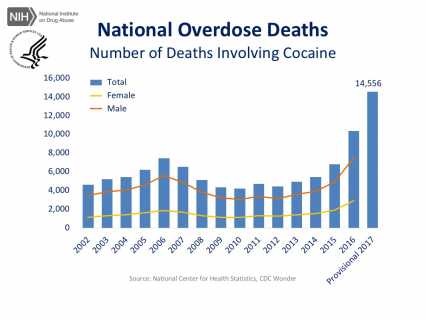
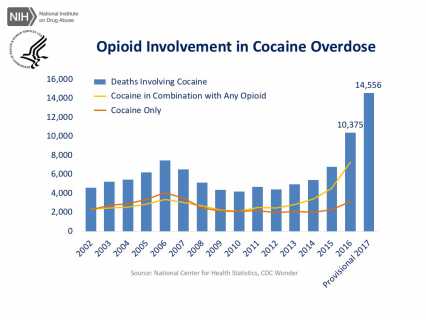
National Overdose Deaths—Number of Deaths Involving Cocaine. The figure above is a bar chart showing the total number of U.S. overdose deaths involving cocaine from 2002 to 2016 and provisional 2017 data. The chart is overlayed by a line graph showing the number of deaths of females and males from 2002 to 2016. From the lowest number in 2010 to 2017, there has been a 3.5-fold increase in the total number of deaths.
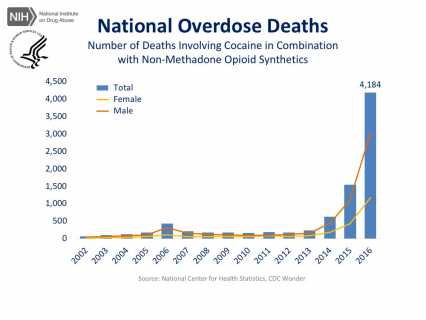
National Overdose Deaths—Number of Deaths Involving Cocaine in Combination with Non-Methadone Opioid Synthetics. The figure above is a bar chart showing the total number of U.S. overdose deaths involving cocaine in combination with other synthetic opioids, dominated by illicit fentanyl. From 2002 to 2016 there was little increase in overall deaths but from 2012 through 2016 there was a 23-fold increase in the total number of deaths. The chart is overlayed by a line graph showing the number of deaths of females and males from 2002 to 2016.
 https://www.drugabuse.gov/videos/nida-opioids
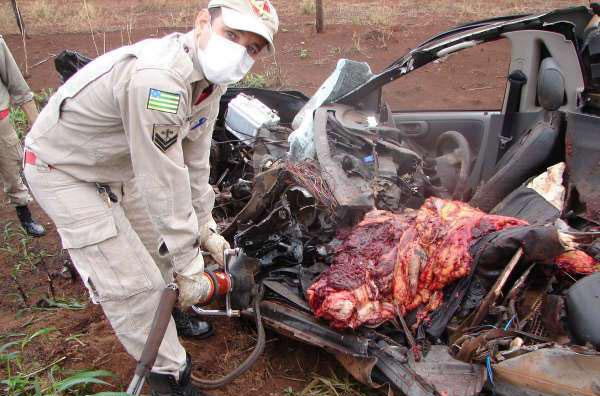
IT ISN'T HARD TO SEE THE DEVIL'S HANDIWORK. THE OPEN BORDER IS DANGEROUS. PLEASE DON'T WALK AWAY FROM THIS WITHOUT ACTING. THE NEXT LIFE OR SUFFERING YOU SAVE MAY BE YOUR OWN.
THIS SHOWS ME THAT THERE IS A VERY REAL DEPOPULATION AGENDA OR THAT THOSE FIGHTING THE BORDER WALL ARE SO SATANICALLY INFLUENCED OR POSSESSED THAT THEY'RE SACRIFICING OUR NATION'S YOUTH FOR POLITICAL POWER. IT'S BEYOND POLITICS. IT'S UNADULTERATED EVIL.
I studied the epidemic along with associates. It began right after Bill Clinton signed NAFTA. Not only did NAFTA gut cities and towns across America (like mine) leaving nothing but despair and then supplying the remedy for that despair: illegal drugs. Manufacturing trucks loaded with goods were packed with illegal drugs and rolled right into the heart of America. Only 3% of trucks were searched. Bill Clinton knew of it and warned the DEA to remain quiet. Just how evil is Bill Clinton? You decide. Look around at all the mass suffering that ensued: families ripped apart by illegal drugs. 72,000 American youth died in one year. Multiply that number by at least 10 for how many lives were directly affected, and hearts ripped out.
Just how evil is Bill Clinton?
Only a heart consumed by the devil could make and maintain such a decision, knowing of the abject suffering that followed and swearing the DEA to secrecy. Was it planned that way? You decide.